Master the Market
Precision Analysis.
SolveB Digital bridges the gap between regional market dynamics and global technical standards. Whether analyzing the ASX, KOSPI, or Nikkei 225, our technical analysis foundations empower you to see beyond the noise of daily fluctuations.
Regional Market Intelligence / インテリジェンス / 지역 시장 인텔리전스
Navigating the Asia-Pacific trade corridor requires more than just access to data. It demands a localized understanding of cultural shifts, regulatory pivots, and technical specificities unique to Australia, Japan, and South Korea.
Nikkei 225 & JPY Dynamics
Understanding the influence of the Bank of Japan on liquidity is paramount. We focus on how traditional industrial giants adapt to digital transformation, providing technical setups for JPY pairs and Nikkei index movements during the Tokyo session.
KOSPI & Technology Fluctuations
The South Korean market serves as a global bellwether for technology and semiconductors. Our analysis bridges the heavyweights like Samsung and SK Hynix with broader KOSPI trends, focusing on high-volatility setups favored by regional day traders.
ASX 200 & Commodity Cycles
For Australian traders, the intersection of mining, banking, and the RBA cash rate decisions creates a unique landscape. We specialize in ASX 200 technical structures and commodity-relative Australian Dollar (AUD) correlations.

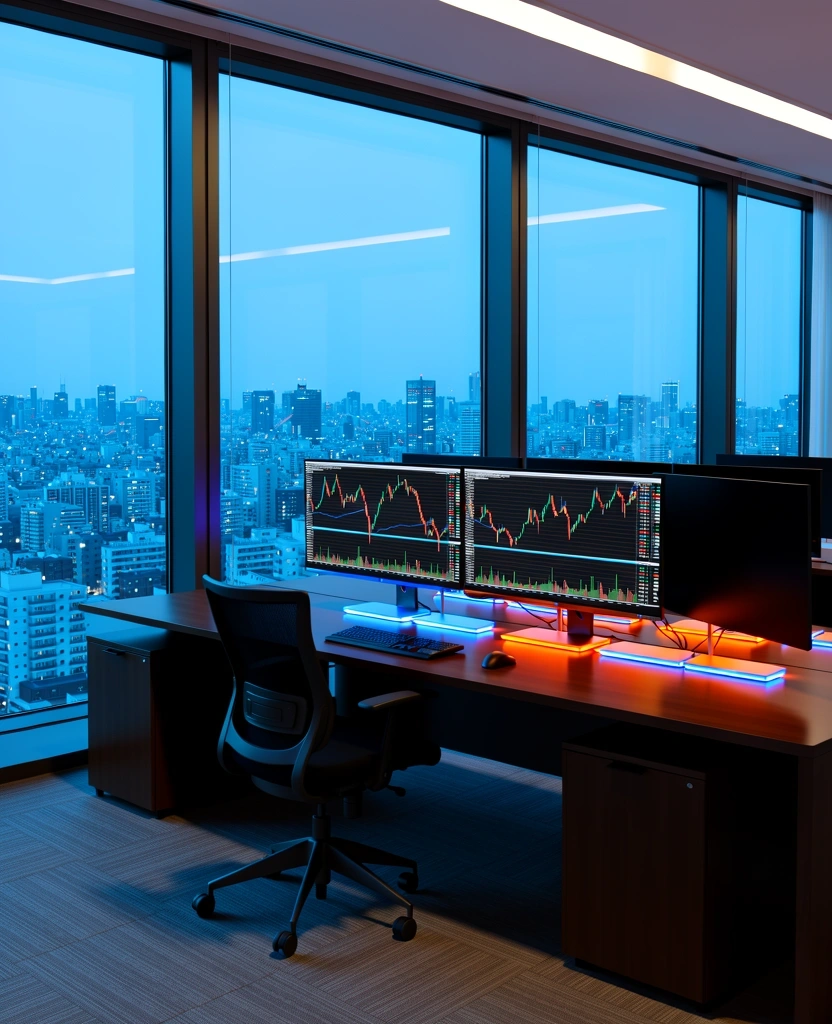
Optimized Workflows with TradingView.
At SolveB Digital, we utilize TradingView as our primary technical visualization engine. Our analysts provide custom Pine Script logic and charting templates specifically tuned for the liquidity profiles of major APAC exchanges.
Advanced Charting
Access multi-timeframe analysis workflows for the ASX, Tokyo Stock Exchange, and KRX with professional-grade clarity.
Automated Logic
Leverage our regional-specific alerts and conditions to stay ahead of cross-border market opening gaps.
Analysis Frameworks
How we approach market structure and trade psychology for our regional consulting clients in Australia, Japan, and Korea.
Liquidity Clusters
In markets like the Nikkei 225, identifying where price has spent the most time is vital for determining institutional interest levels. We map these clusters to identify high-probability zones.
Geometric Fidelity
Markets often repeat structures based on Fibonacci ratios. We teach the recognition of Gartleys, Bats, and Butterflies within the specific volatility parameters of the KOSPI and Tech indices.
Intermarket Flow
Analyzing the relationship between the US Dollar and APAC equity markets isn't optional. We provide frameworks for tracking risk-on/risk-off sentiment across regional borders.
Start Your Professional
Analytical Journey.
Our 2026 Curriculum covers more than just technical indicators. It bridges the gap between raw data on TradingView and actionable decision-making in real-time markets. We help financial professionals in Chiyoda-ku and beyond refine their edge.
Contact our Analysts
Reach out for custom analysis inquiries or career mentorship in the financial sector.
Consulting Details